地球资源数据云——数据资源详情
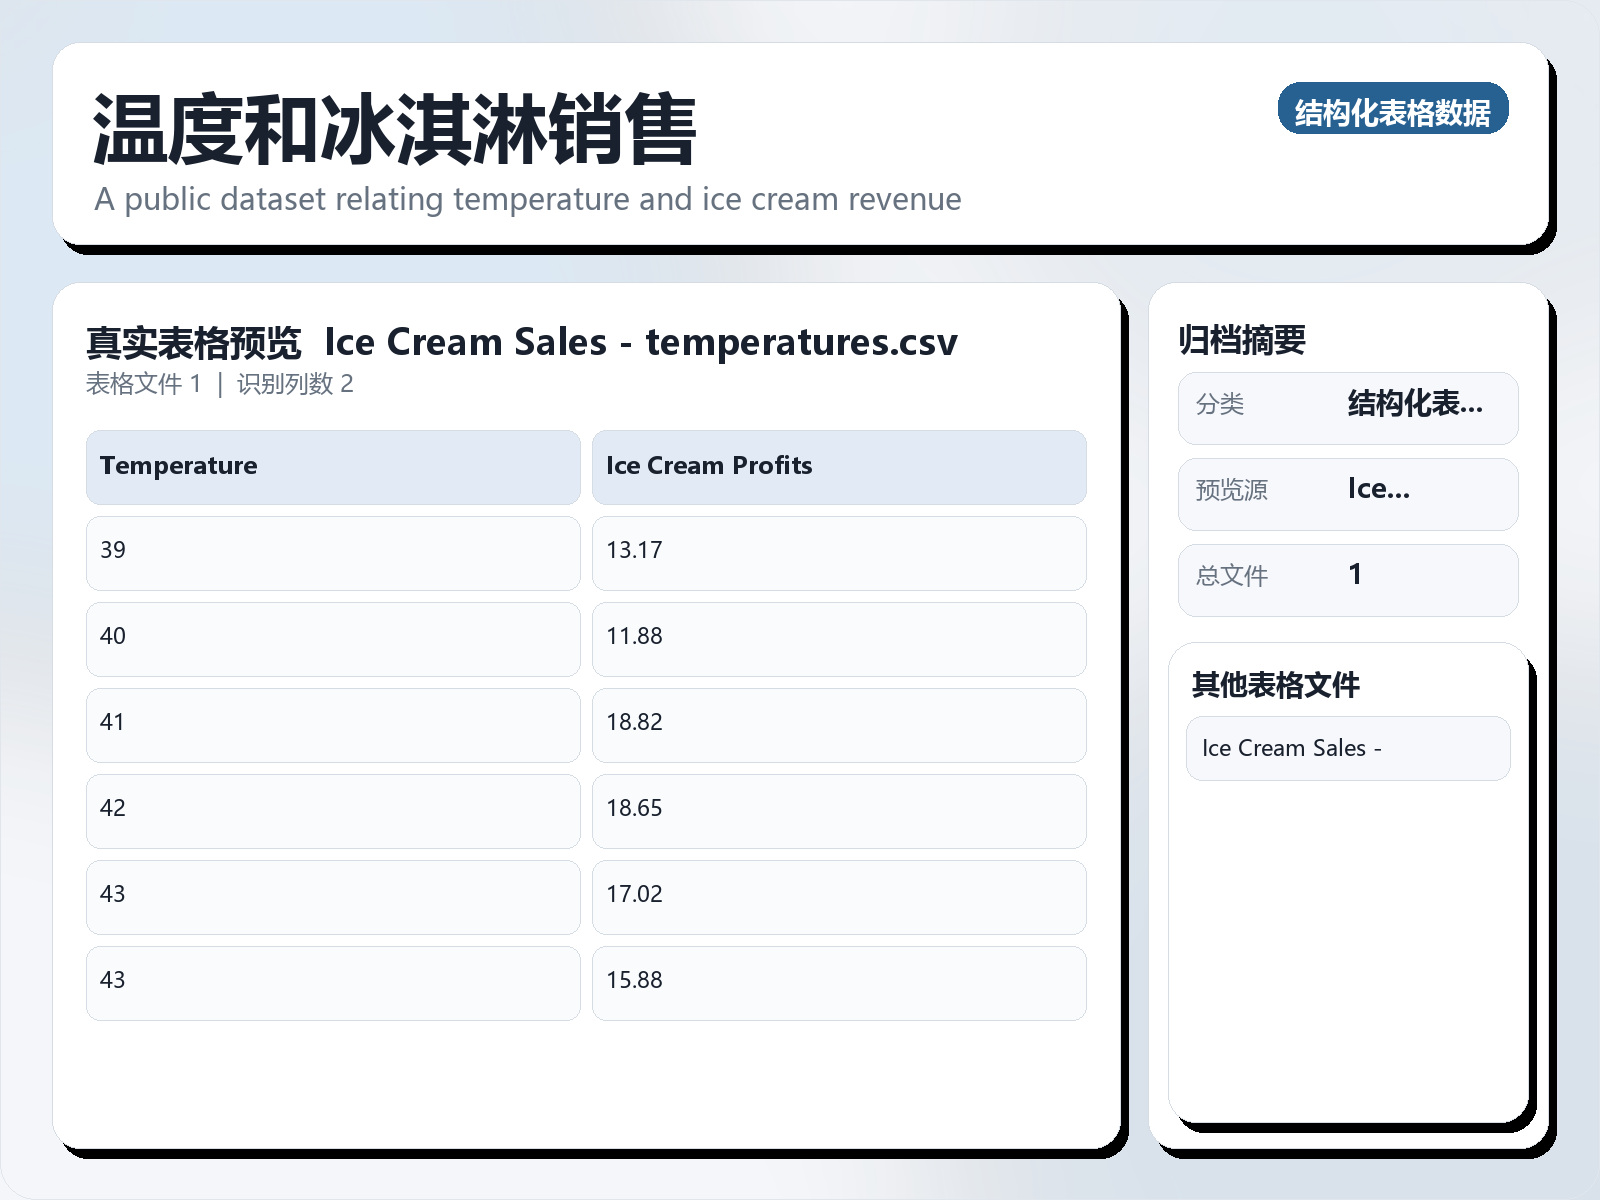
温度和冰淇淋销售
该数据集《Temperature and Ice Cream Sales》主要用于回归/预测任务,数据形态以表格为主。 题目说明:A public dataset relating temperature and ice cream revenue 任务类型:表格回归/预测。 建议流程:先做缺失值/异常值处理与特征编码,再比较逻辑回归、随机森林、XGBoost。 评估建议:使用分层切分或交叉验证,优先关注 F1、Recall、AUC 等分类指标。 可用文件:Ice Cream Sales - temperatures.csv。 Project is still being worked on. Initially, this dataset was just for a Google Data Analytics project, where I was given a task to accomplish with the data in a spreadsheet: look at the table given in the spreadsheet, and see if there's a correlation between temperature and revenue in ice cream sales. Eventually, I did see the pattern: higher temperatures usually meant more revenue, which seems realistic. However, I wanted to dig further into the data and perform a deeper analysis using a visualization, and maybe even a regression. My new questions were, "How strong is this correlation?" and "Can we represent the data using a linear regression?"
摘要概览
该数据集《Temperature and Ice Cream Sales》主要用于回归/预测任务,数据形态以表格为主。 题目说明:A public dataset relating temperature and ice cream revenue
任务类型:表格回归/预测。
建议流程:先做缺失值/异常值处理与特征编码,再比较逻辑回归、随机森林、XGBoost。
评估建议:使用分层切分或交叉验证,优先关注 F1、Recall、AUC 等分类指标。
可用文件:Ice Cream Sales - temperatures.csv。
Project is still being worked on.
Initially, this dataset was just for a Google Data Analytics project, where I was given a task to accomplish with the data in a spreadsheet: look at the table given in the spreadsheet, and see if there's a correlation between temperature and revenue in ice cream sales.
Eventually, I did see the pattern: higher temperatures usually meant more revenue, which seems realistic. However, I wanted to dig further into the data and perform a deeper analysis using a visualization, and maybe even a regression. My new questions were, "How strong is this correlation?" and "Can we represent the data using a linear regression?"
常见问题
温度和冰淇淋销售是什么?
该数据集《Temperature and Ice Cream Sales》主要用于回归/预测任务,数据形态以表格为主。
温度和冰淇淋销售是什么数据格式?坐标系是什么?
数据格式为 CSV。
如何获取并引用温度和冰淇淋销售?
在本页登录后即可下载。建议引用格式:地球资源数据云. 温度和冰淇淋销售. https://www.gis5g.com/dataset/2032012344551706626