地球资源数据云——数据资源详情
世界各国识字率
该数据集《World Literacy Rate by Country》主要用于监督学习任务,数据形态以文本为主。 题目说明:A Comprehensive Overview of Global Education Levels 任务类型:文本监督学习。 建议流程:先做文本清洗与分词,再比较 TF - IDF+线性模型 与 预训练语言模型。 评估建议:使用分层切分或交叉验证,优先关注 F1、Recall、AUC 等分类指标。 可用文件:Literacy Rate.csv。 The "World Literacy Rate by Country" dataset provides a detailed snapshot of literacy rates across different countries in the world. This dataset is organized into several key columns: S.No: This column lists the serial number for each country, helping to keep the data organized and easy to reference. Country: This column names the countries included in the dataset, allowing for a clear understanding of which nation each literacy rate pertains to. Literacy rate in percentage: This column shows the literacy rate of each country, expressed as a percentage. This figure represents the proportion of the population that can read and write. Year: This column indicates the year in which the literacy rate was recorded, providing a temporal context for the data. By examining this dataset, you can gain insights into the educational progress and challenges faced by different countries in the world.
摘要概览
该数据集《World Literacy Rate by Country》主要用于监督学习任务,数据形态以文本为主。 题目说明:A Comprehensive Overview of Global Education Levels
任务类型:文本监督学习。
建议流程:先做文本清洗与分词,再比较 TF - IDF+线性模型 与 预训练语言模型。
评估建议:使用分层切分或交叉验证,优先关注 F1、Recall、AUC 等分类指标。
可用文件:Literacy Rate.csv。
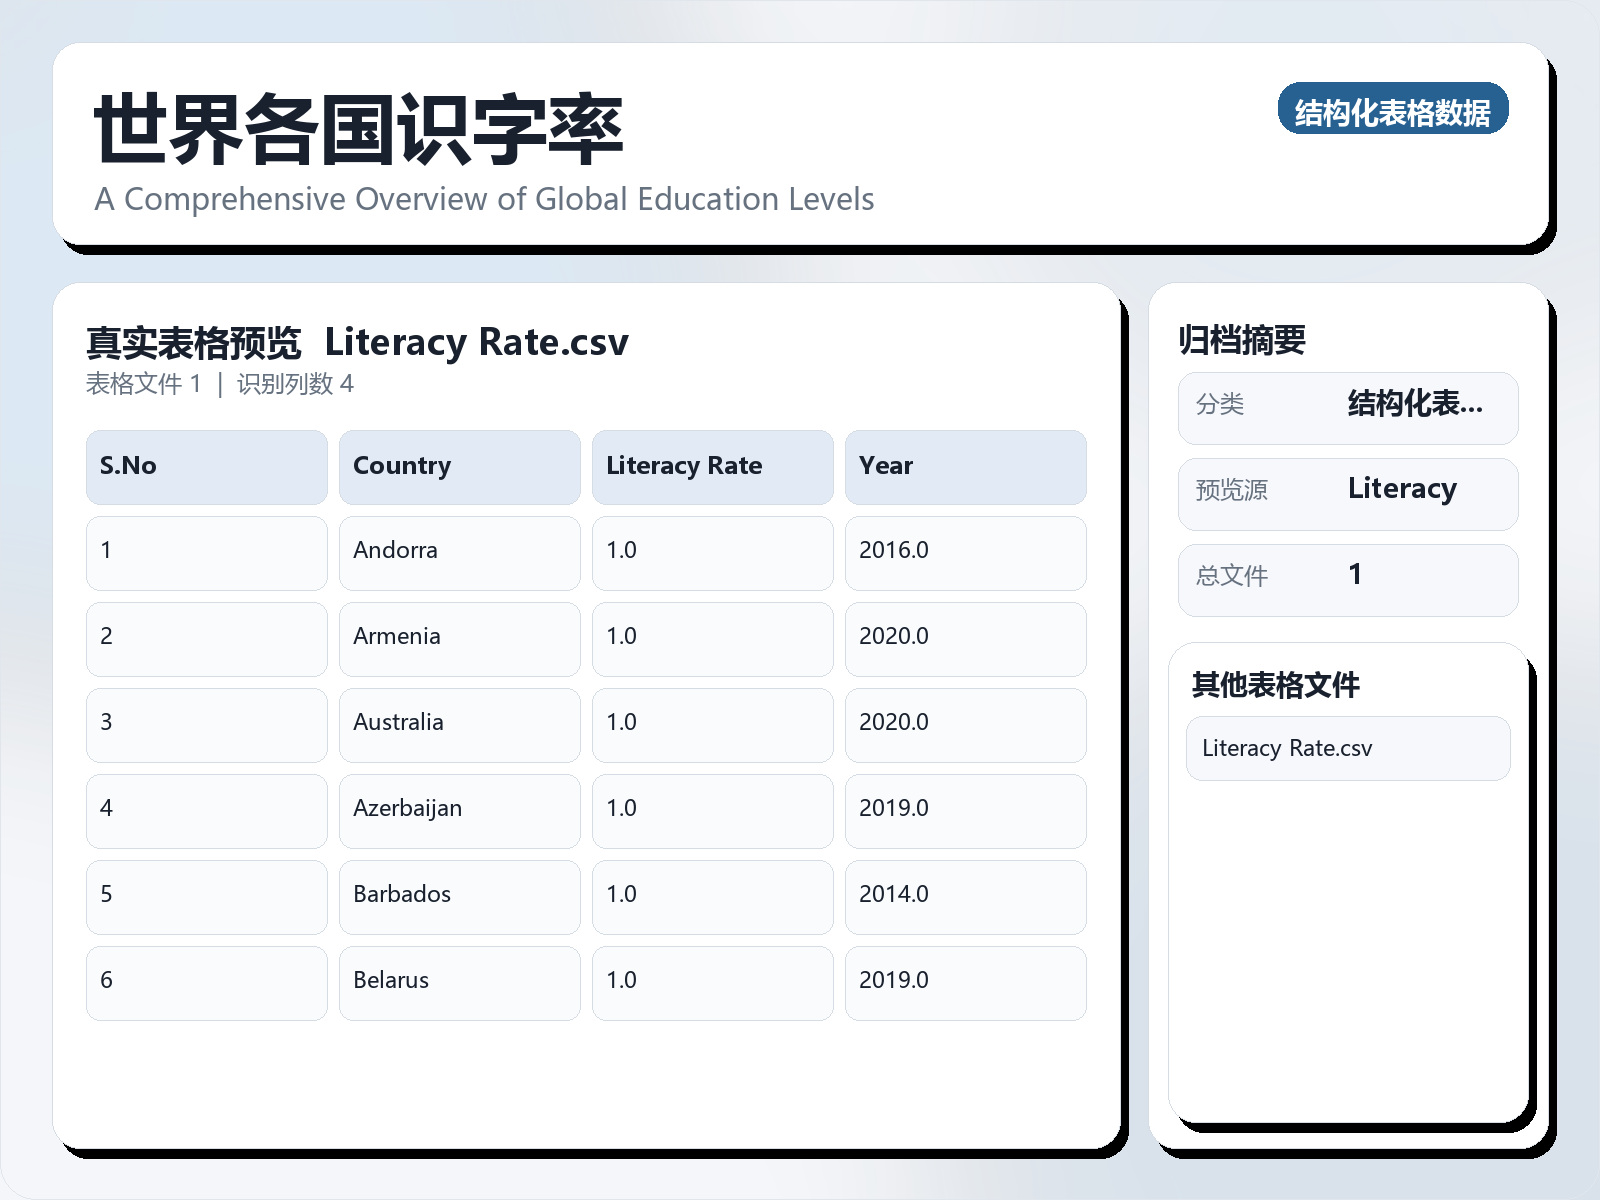
The "World Literacy Rate by Country" dataset provides a detailed snapshot of literacy rates across different countries in the world. This dataset is organized into several key columns:
S.No: This column lists the serial number for each country, helping to keep the data organized and easy to reference. Country: This column names the countries included in the dataset, allowing for a clear understanding of which nation each literacy rate pertains to.
Literacy rate in percentage: This column shows the literacy rate of each country, expressed as a percentage. This figure represents the proportion of the population that can read and write. Year: This column indicates the year in which the literacy rate was recorded, providing a temporal context for the data.
By examining this dataset, you can gain insights into the educational progress and challenges faced by different countries in the world.
常见问题
世界各国识字率是什么?
该数据集《World Literacy Rate by Country》主要用于监督学习任务,数据形态以文本为主。
世界各国识字率是什么数据格式?坐标系是什么?
数据格式为 CSV。
世界各国识字率覆盖什么区域?
该数据集覆盖范围为全球。
世界各国识字率包含哪些字段或指标?
主要字段或指标包括S.No: This column lists the serial number for each country, helping to keep the data organized and easy to reference. Country: This column names the countries included in the data…。
如何获取并引用世界各国识字率?
在本页登录后即可下载。建议引用格式:地球资源数据云. 世界各国识字率. https://www.gis5g.com/dataset/2031996126323183617