地球资源数据云——数据资源详情
COVID-19 数据分析和可视化
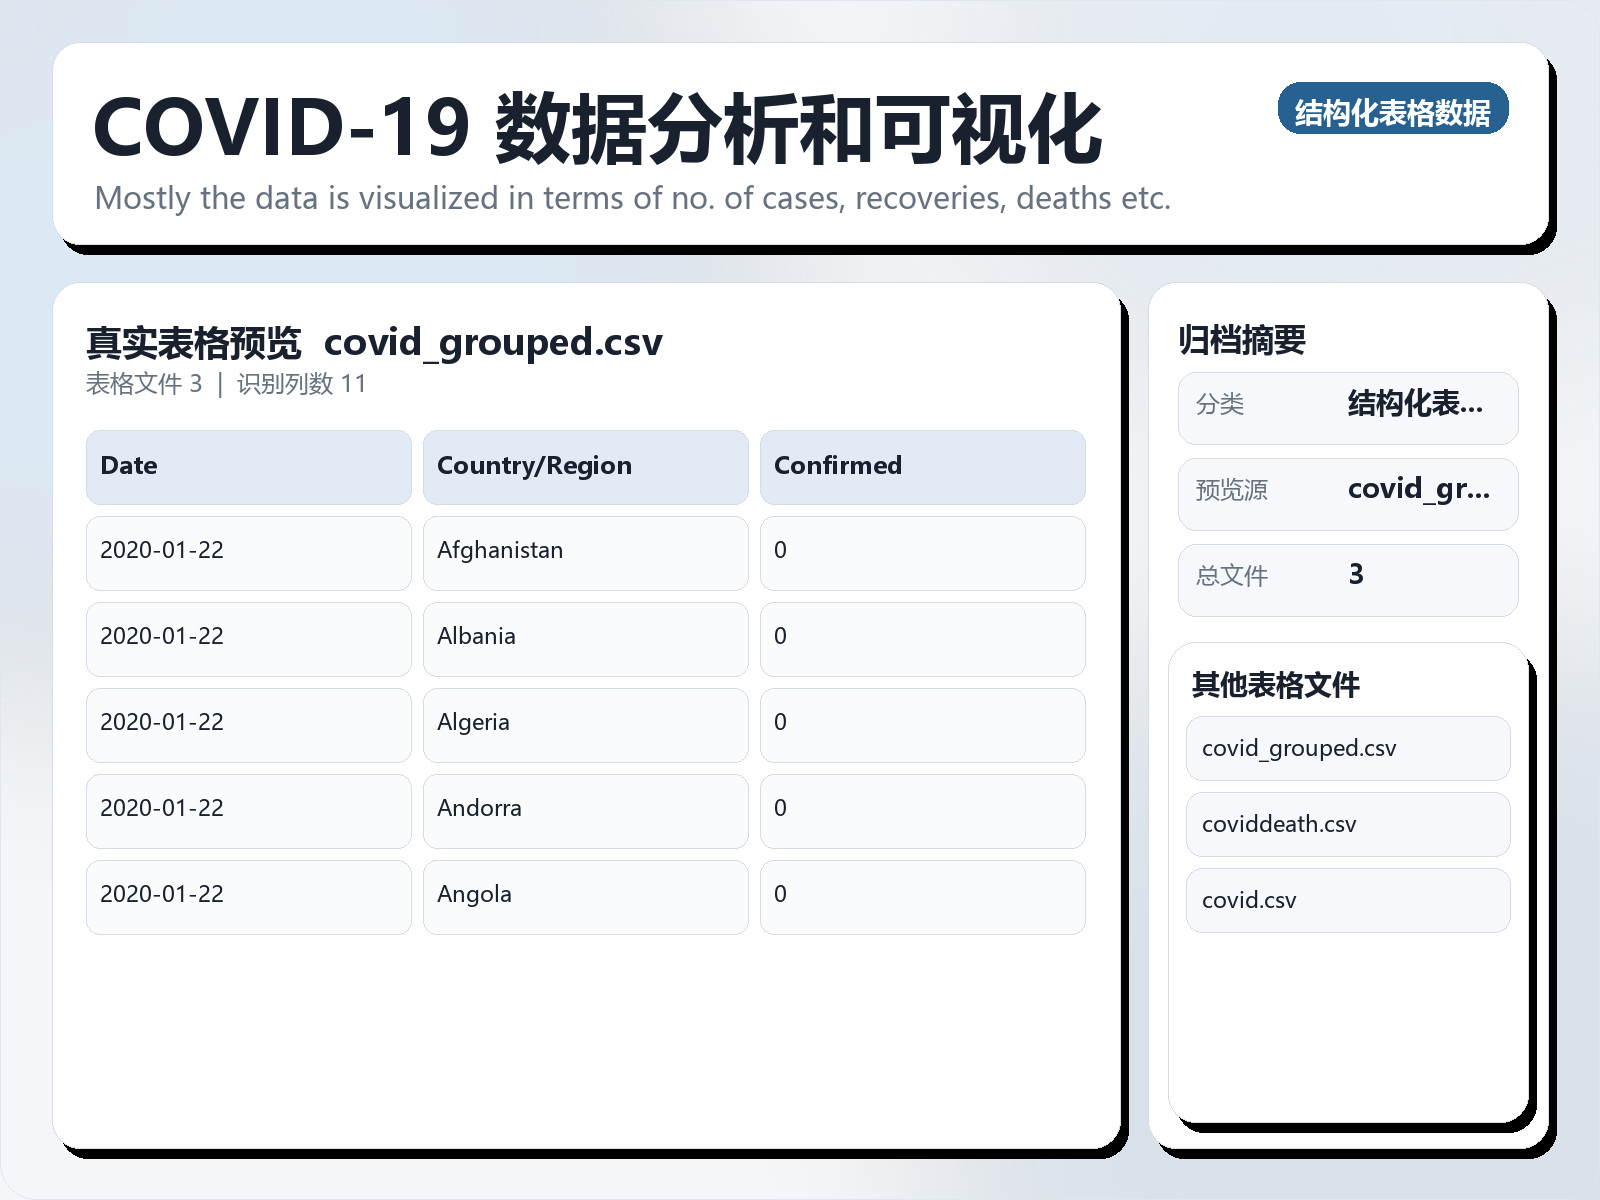
该数据集《COVID - 19 Data Analysis and Visualization》主要用于监督学习任务,数据形态以表格为主。 题目说明:Mostly the data is visualized in terms of no. of cases, recoveries, deaths etc. 任务类型:表格监督学习。 建议流程:先做缺失值/异常值处理与特征编码,再比较逻辑回归、随机森林、XGBoost。 评估建议:使用分层切分或交叉验证,优先关注 F1、Recall、AUC 等分类指标。 可用文件:covid.csv, covid_grouped.csv, coviddeath.csv。 Being on the data platform and posting my first ever notebook on Kaggle, and earlier, I have tried the same on Google Colab as well. Using Pandas in Python, I have visualized how the Covid19, which is prevailing worldwide and has drastically depleted many lives, also made life a tragedy. Here, I have used Matplotlib for the plots and have also elaborated the same using Plotly. Thanks!
摘要概览
该数据集《COVID - 19 Data Analysis and Visualization》主要用于监督学习任务,数据形态以表格为主。 题目说明:Mostly the data is visualized in terms of no. of cases, recoveries, deaths etc.
任务类型:表格监督学习。
建议流程:先做缺失值/异常值处理与特征编码,再比较逻辑回归、随机森林、XGBoost。
评估建议:使用分层切分或交叉验证,优先关注 F1、Recall、AUC 等分类指标。
可用文件:covid.csv, covid_grouped.csv, coviddeath.csv。
Being on the data platform and posting my first ever notebook on Kaggle, and earlier, I have tried the same on Google Colab as well. Using Pandas in Python, I have visualized how the Covid19, which is prevailing worldwide and has drastically depleted many lives, also made life a tragedy.
Here, I have used Matplotlib for the plots and have also elaborated the same using Plotly.
Thanks!
常见问题
COVID-19 数据分析和可视化是什么?
该数据集《COVID - 19 Data Analysis and Visualization》主要用于监督学习任务,数据形态以表格为主。
COVID-19 数据分析和可视化是什么数据格式?坐标系是什么?
数据格式为 CSV。
COVID-19 数据分析和可视化覆盖什么区域?
该数据集覆盖范围为全球。
如何获取并引用COVID-19 数据分析和可视化?
在本页登录后即可下载。建议引用格式:地球资源数据云. COVID-19 数据分析和可视化. https://www.gis5g.com/dataset/2031264121675485185